building "getMe" - II

Compaction in detail
Phase 1: Distilling Live Data with Map-Reduce
The first step of compaction is to figure out which data is still "live" across all the old, inactive segments. We achieve this using the same powerful Map-Reduce pattern employed during startup.
Identify Candidates: The SegmentManager selects a batch of inactive segments for compaction. The currently active segment is never chosen, as it's still being written to.
Map Phase: A dedicated goroutine is launched for each candidate segment. Each goroutine reads its segment file and builds a small, in-memory
HashTablecontaining only the latest key locations within that single segment. These isolated hash tables are then sent over a channel.Reduce Phase: The main compaction goroutine receives these hash tables and merges them into a single, definitive updatedHashTable. The
HashTable.Mergelogic is critical here: it resolves conflicts by comparing timestamps, ensuring that only the entry with the newest timestamp for each key survives.
At the end of this phase, we have a clean, in-memory index (updatedHashTable) that represents the complete set of live data from all the segments being compacted.
Phase 2: The Compaction Ground
With the live data identified, the SegmentManager hands off control to the CompactedSegmentManager. This component acts as an isolated "workshop" to build the new, clean segments.
Initialization: The
CompactedSegmentManageris given the updatedHashTable and the block of reserved segment IDs. It creates a temporary directory to build the new segments in isolation.Re-writing Data: It iterates through the updatedHashTable. For each entry, it performs a three-step process:
a. It reads the full entry (key, value, timestamp) from its original location in the old, soon-to-be-deleted segment.
b. It appends this full entry to a new, compacted segment file within its temporary workshop directory.
c. It updates the entry's location (Segment ID and Offset) within the updatedHashTable to point to its new home in the compacted segment.
This process continues, creating new compacted segment files as needed, until all live data has been rewritten. The result is a set of dense segment files and a compactedHashTable that accurately maps keys to these new, efficient locations.
Phase 3: Merging and Cleanup
Once the CompactedSegmentManager has finished its work, it's time to integrate the results back into the live system. This is where the asynchronous design truly shines.
Sending the Result: The
SegmentManagerpackages the compactedHashTable and a list of the old segment IDs into aCompactionResultstruct. It then sends this result over a dedicated Go channel: compactionResultChannel.The Listener Goroutine: The
Storeobject, our top-level component, runs a dedicated background goroutine from the moment it's created. Its sole purpose is to listen on this compactionResultChannel.Applying the Result: When the listener receives a
CompactionResult, it triggers the final, atomic steps:Move New Segments: The
SegmentManagermoves the newly created segment files from the temporary directory into the main data directory.Merge Index: The
Storemerges the compactedHashTable into its main, liveHashTable. Again, the timestamp-aware merge logic ensures data integrity.Delete Old Segments: Finally, the
SegmentManagerdeletes the old, now-obsolete segment files from disk, freeing up space.
func (sm *SegmentManager) PerformCompaction(segments []*Segment, currAvailableSegmentId uint32) {
	defer sm.isCompacting.Store(false)
	defer sm.compactionWg.Done()

	if len(segments) == 0 {
		logger.Info("No segments available for compaction")
		return
	}

	logger.Debug("Starting compaction for segments, creating a channel")

	// creating a new scoped hash table based on the segments to be compacted
	resultChan := make(chan *HashTable, len(segments))

	var wg sync.WaitGroup

	// read all the entries in these segments and create a new hash table, which contains latest and unique entries in the scope of these segments
	for _, segment := range segments {
		wg.Add(1)
		segment.readAllEntriesAsync(&wg, resultChan)
	}

	go func() {
		wg.Wait()
		close(resultChan)
	}()

	updatedHashTable := NewHashTable()

	for ht := range resultChan {
		updatedHashTable.Merge(ht)
	}

	logger.Info("updated hash table created")
	logger.Info("active segment id updated to:", currAvailableSegmentId)

	sm.compactedSegmentManager.nextAvailableSegmentId = currAvailableSegmentId
	sm.compactedSegmentManager.maxAvailableSegmentId = currAvailableSegmentId + uint32(len(segments)) - 1

	// we can send the entire segment map, since compaction only deals with inactive segments and it is not being modified
	sm.compactedSegmentManager.originalSegmentMap = sm.getScopedSegmentMap(segments)

	// populate the compacted segments in the compacted segment manager and retrieve a hashtable which references the new locations of the entries (in the compacted segments)
	compactedHashTable, err := sm.compactedSegmentManager.populateCompactedSegments(updatedHashTable)
	if err != nil {
		logger.Error("performCompaction: failed to populate compacted segments: ", err)
		return
	}

	sm.mu.Lock()

	// bring the segments from the compacted segment manager to the main segment manager
	// this needs to be an atomic operation
	for id, segment := range sm.compactedSegmentManager.compactedSegmentMap {
		newPath := filepath.Join(sm.basePath, fmt.Sprintf("segment_%d.log", id))
		err := os.Rename(segment.path, newPath)
		if err != nil {
			logger.Error(fmt.Errorf("performCompaction: failed to move compacted segment file %s to %s: %w", segment.path, newPath, err))
			return
		}
		segment.path = newPath
		sm.segmentMap[id] = segment
	}

	logger.Debug("clearing the compacted segment map")
	sm.compactedSegmentManager.clearManager()

	// end of critical section
	sm.mu.Unlock()

	// send the compacted hashtable and the old segment ids to be deleted to the main segment manager via the compaction result channel
	sm.compactionResultChannel <- &CompactionResult{
		CompactedHashTable: compactedHashTable,
		OldSegmentIds: func() []uint32 {
			var ids []uint32
			for _, segment := range segments {
				ids = append(ids, segment.id)
			}
			return ids
		}(),
	}
}
This decoupled, channel-based communication ensures that the final merge and cleanup operations are orderly and thread-safe, completing the compaction lifecycle without ever having to halt the database. The system utilizes defer semantics to safely toggle state flags and signal WaitGroup completion, guaranteeing a robust shutdown sequence when WaitCompactions() is invoked during a graceful exit. It's a robust, concurrent architecture that allows getMe to maintain high performance and a small storage footprint over time.
Observability
A database that you can't see inside of, is a black box. Period.
To build a system that is reliable and debuggable, you need to be able to observe its behavior in real time. For getMe, observability is a core feature, built-in from the ground up using a powerful, containerized stack. This section dives into the "how"—the infrastructure that lets us watch the engine run.
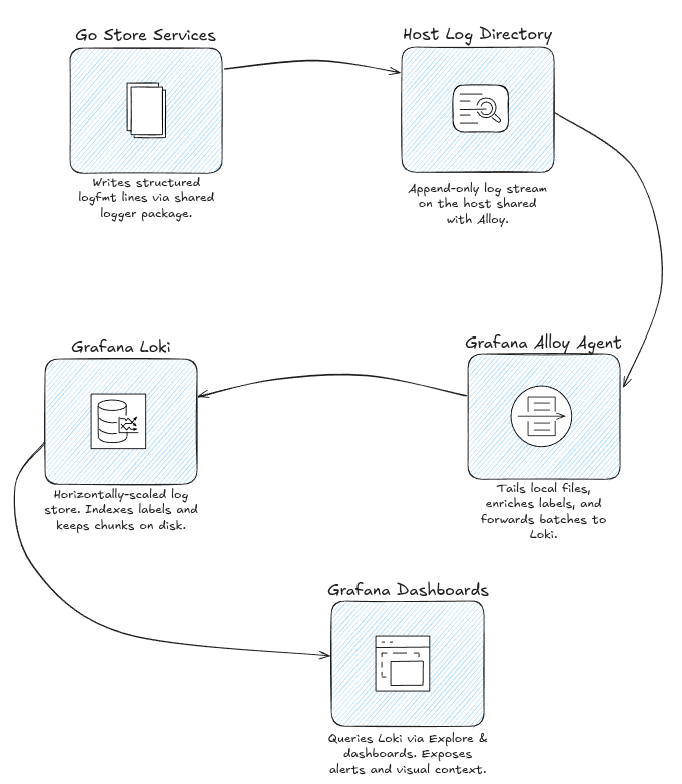
a. The Logging Stack: Loki, Grafana, and Alloy
getMe's observability platform is built around a modern suite of tools for log aggregation and visualization:
Loki: The log storage backend. Think of it as a database specifically designed for logs, indexing them efficiently based on metadata (labels) rather than the full text of the message.
Grafana: The beautiful and powerful visualization layer. It provides the dashboards, graphs, and querying UI to explore the log data stored in Loki.
Alloy (formerly Promtail): The collector and agent. Alloy's job is to live alongside the application, discover its log files, process them, and ship them off to Loki.
The entire infrastructure is orchestrated using Docker Compose, which allows this multi-container stack to be defined and launched with a single command. This container-based approach provides a clean, isolated, and repeatable environment. In fact, getMe provides a unified docker-compose.yml that stands up the get_me_store core engine alongside the entire logging stack, binding everything together seamlessly.
b. The Journey of a Log Message
The flow of information from the application to the dashboard is a clear, decoupled pipeline:
Generation: The
getMeGo application (running inside its ownContainerFile-built image) writes its logs to a file inside a dedicated directory (/tmp/getMeStore/dumpDir).Collection: This log directory is shared with the
grafana-alloycontainer using a named Docker volume (log-dump). Alloy is configured to automatically discover and "tail" any.logfiles that appear in this shared directory.Processing: As Alloy reads each log line, it doesn't just forward it blindly. It processes the line, parsing its
logfmtstructure to extract key fields likelevelandmsg, and adds alevellabel to the log entry. This enrichment makes filtering and analysis in Grafana much more powerful.Storage: Alloy then pushes the processed and labeled log entry to the
grafana-lokiservice. Loki indexes the log based on its labels (job,environment,level) and stores it efficiently.Visualization: Finally, Grafana is pre-configured to use Loki as a data source. A developer can simply open a web browser to the Grafana UI, use the "Explore" view, and immediately start querying logs with Loki's powerful LogQL language (e.g.,
{job="getMe-app"} | json | level="error").
c. The Significance of Volumes and Bind Mounts
The Docker Compose setup strategically uses different data persistence mechanisms to solve specific problems:
Application Data (Named Volume): The segment files—the actual database—reside in a named Docker volume. This is critical because it ensures the database's data persists even if the
getMecontainer is destroyed and recreated. This guarantees durability.Log Data (Named Volume): The log files are written to another named volume, which is shared between the
getMecontainer and thegrafana-alloycontainer. This is a perfect example of a decoupled design:getMedoesn't need to know or care about where its logs are going; it just writes them to a file. Alloy handles the rest.Unix Domain Socket (Bind Mount): The UDS is the bridge between the world inside the container and the developer's local machine. By using a bind mount, a directory on the host is mapped directly into the container. When the
getMeserver creates its socket file inside the container, that file instantly appears on the host, allowing local tools like thegetMeCLI to connect to the server seamlessly.
d. A Foundation for the Future: From Logging to Full-Fledged Metrics
A significant advantage of this architecture is its extensibility. The work done to containerize the application and set up the logging pipeline has laid the perfect foundation for a complete performance monitoring solution. Adding metrics isn't an architectural overhaul; it's an incremental step. The path forward is clear:
Instrument the Application: The
getMeGo application can be easily instrumented to expose performance metrics (like latency, throughput, and memory usage) via a standard Prometheus-compatible/metricsendpoint.Scrape Metrics with Alloy: Grafana Alloy is more than just a log collector; it can also be configured to "scrape" these metrics endpoints.
Visualize in Grafana: The scraped time-series data can be stored and then visualized in Grafana, creating dashboards with graphs that show performance trends over time.
A sample from the unified docker-compose file comprising the engine and the logging stack:
services:
  # Main application service
  get_me_store:
    build:
      context: ../
      dockerfile: ContainerFile
      target: final
    container_name: get_me_store
    volumes:
      - get-me-store-data:/var/lib/getMeStore/dataDir
      - log-dump:/tmp/getMeStore/dumpDir
      - /tmp/getMeStore/sockDir:/tmp/getMeStore/sockDir

  grafana-loki:
    image: grafana/loki:3.4.2
    container_name: grafana-loki
    volumes:
      - ./utils/logger/loki:/etc/loki
      - loki-storage:/loki
    ports:
      - "3100:3100"

  grafana-alloy:
    image: grafana/alloy:v1.11.2
    container_name: grafana-alloy
    volumes:
      - ./utils/logger/alloy/config.alloy:/etc/alloy/config.alloy
      - log-dump:/var/log/getme:ro
    ports:
      - "12345:12345"

  grafana:
    image: grafana/grafana:11.0.0
    container_name: grafana
    ports:
      - "3000:3000"
    volumes:
      - grafana-storage:/var/lib/grafana
      - ./utils/logger/grafana/provisioning:/etc/grafana/provisioning
This powerful, built-in observability stack transforms getMe from a simple storage engine into a transparent, debuggable, and production-ready system.
Venues of Improvement
Building a storage engine is a journey of continuous refinement.
While the current architecture of getMe is robust and functional, its very construction reveals exciting avenues for future enhancements. Here are some of the most promising areas for improvement, categorized by the problems they aim to solve.
a. Boosting Concurrency and Performance
While getMe is designed for high write throughput, performance can always be pushed further.
Sharded In-Memory Index: The single
RWMutexprotecting theHashTableis a point of contention. While it allows parallel reads, all writes must wait in a single line. The next logical step is to shard the hash table. Instead of one giant map, we could have an array of smaller maps (e.g., 16 or 32 of them), each with its own dedicated lock. A key would be hashed to determine which shard it belongs to, allowing multiple write operations to proceed in parallel, provided they don't land in the same shard. This would significantly improve write concurrency on multi-core systems.Memory-Mapped I/O (mmap): The current I/O model relies on standard
ReadandWritesystem calls. A powerful alternative is to usemmapto map the segment files directly into the application's virtual address space. This can offer a performance boost by reducing system call overhead and allowing the operating system's virtual memory manager to more intelligently handle the paging of data between disk and RAM.
b. Enhancing Data Reliability and Recovery
Durability is key, and we can add more layers of protection and speed up recovery.
Checksums for Data Integrity: Right now, we trust that the bits we read from disk are the same ones we wrote. But storage media can degrade over time ("bit rot"). A crucial improvement would be to add a checksum (like CRC32) to every
Entrybefore it's written to the log. When the entry is read back, the checksum would be re-verified. A mismatch would immediately signal data corruption, preventing the application from acting on invalid data.Faster Startup with an Index Snapshot: Rebuilding the
HashTableby reading every segment file works perfectly, but it can be slow for very large datasets. To optimize this, we could implement index snapshots. Periodically, a snapshot of the in-memory hash table could be written to a dedicated file. On the next startup,getMecould load this much smaller snapshot file and then only read the segment files created after the snapshot was taken, dramatically reducing recovery time.
c. Expanding the Feature Set
With a solid foundation, we can build more advanced database features.
Time-To-Live (TTL) Support: Many use cases require data to expire automatically. This could be implemented by adding a
TTLorExpiryTimestampfield to theEntrystruct. The compaction process would then be enhanced to not only clean up stale and deleted data but also to discard any entries whose TTL has expired, effectively providing free, automated data expiration.Transactions: Introducing basic ACID transaction support would be a major leap. This would involve a mechanism to batch a series of
PutandDeleteoperations into a single, atomic unit that is written to the log. The commit would only happen at the end, making all the changes visible at once, or rolling back if an error occurs.Snapshots and Backups: The immutable nature of closed segments makes snapshots surprisingly straightforward. A feature could be added to create a "snapshot" by simply recording the current list of active segment files. For a backup, these files could then be copied to a remote location without any risk of them being modified during the copy process.
d. Improving Operations and Tunability
External Configuration: Key operational parameters like the
maxSegmentSizeand compaction thresholds are currently hardcoded. Exposing these as settings in a configuration file would allow users to tune the database for their specific workloads, balancing memory usage, disk space, and performance.Richer Metrics: As explored in the observability section, the foundation is in place for deeper monitoring. The next step is to instrument the application to expose richer internal metrics—cache hit/miss rates, lock contention times, compaction duration, and detailed I/O statistics—to provide a truly comprehensive view of the system's health and performance.
Bridging the Gap: The Model Context Protocol (MCP)
As we stand on the brink of a new era in software interaction, the traditional boundaries between data and users are blurring. The rise of Large Language Models (LLMs) has introduced a new kind of user: the AI agent. These agents don't click buttons or write SQL; they reason, plan, and execute tasks using tools. For a storage system to be truly "future-proof," it must be fluent in this new language of interaction.
To address this, getMe has been extended with a Model Context Protocol (MCP) server. MCP is an open standard that defines how AI models discover and interact with external data and tools. By implementing this protocol, getMe transforms from a passive data store into an active, accessible tool in an AI's utility belt.
The Architecture of the MCP Server
The MCP implementation is designed with the same philosophy of simplicity and modularity as the core engine. It is built as a lightweight Python service that acts as a bridge between the AI model and the getMe core.
The Interface: Using the
FastMCPlibrary, the server exposes the core database operations—get,put,delete,batch_put, and more like JSON fetching—as distinct "tools." An LLM can inspect these tool definitions to understand exactly what the database can do and how to use it.The Connection: True to the local-first ethos of the project, the MCP server connects to the main
getMeengine via the existing Unix Domain Socket (UDS) usinghttpx.AsyncClient. This ensures that even when an AI is driving the interactions, the system retains its high-throughput, low-latency characteristics.
Here is a glimpse of how the core operations are intelligently exposed based on configuration:def build_mcp() -> FastMCP: mcp = FastMCP("getMe") client = GetMeClient(socket_path=config.socket_path(), base_url=config.base_url()) @mcp.tool() async def get(key: str) -> str: """Get a value by key.""" return await client.get(key) @mcp.tool() async def get_json(key: str) -> Any: """Get a value by key and parse it as JSON.""" return await client.get_json(key) # Only register write tools if the store is not read-only. if not config.is_read_only(): @mcp.tool() async def put(key: str, value: str) -> str: """Put a (key, value) pair.""" return await client.put(key, value) @mcp.tool() async def batch_put(pairs: dict[str, str]) -> Any: """Batch put from a map of key -> value.""" return await client.batch_put(pairs) # ... other tools (delete, batch_delete, clear, etc.) return mcp
Why This Matters!
This integration represents a fundamental shift in utility. It allows an AI assistant to natively "remember" context, store user preferences, or manage state across sessions without requiring complex, custom integration logic. By speaking MCP, getMe ensures that it is not just a repository for the past, but a building block for the intelligent applications of the future.
Ecosystem and Tooling
A storage engine is only as useful as its integrations. To bridge the gap between the low-level Unix Domain Socket and higher-level applications, getMe provides a complete ecosystem:
1. HTTP Proxy
For remote clients or environments where UDS is inaccessible, a lightweight http-proxy-go daemon acts as a bridge. It binds to a standard TCP port (e.g., 8080) and forwards standard REST API calls over to the core UDS socket natively.
2. Multi-Language SDKs
Developers can seamlessly integrate getMe into their applications using native SDKs:
Go SDK: The native driver, enabling typed interactions, HTTP over UDS mapping, and batch chunking logic.
JavaScript / TypeScript SDK: Leverages
axiosconfigured with a customsocketPathto communicate directly with the local engine in Node.js apps.Python SDK: Employs
requests_unixsocket(andhttpxfor async workflows) for data science and AI applications.Java SDK: Provides robust integration models including Spring Boot autoconfiguration.
3. Formal Benchmarking
Robustness requires proof. getMe includes a dedicated benchmarking infrastructure composed of two critical test suites:
stressTest: Evaluates parallel write/read throughput across operations likePut,Get,BatchGet, and mixed-ratio operations simulating heavy real-world loads.correctnessCheck: Focuses on data integrity, aggressively interleaving concurrent reads and writes, deleting keys, and subsequently validating that the exact expected state is successfully mapped from disk.
What does the future look like?
It all started out as a simple experiment around thread-safe read/write for a Key-Value store. I have been able to pickup so much, by simply identifying the dimensions and scope of the problem, as I dove further and further, or simply fueled by the desire to make it more robust and industry-ready overall.
I grasped much around the basic features and parallel compute specifics of golang (goroutines, channels, waitgroup, etc.)
Most importantly, most of these implementations (and improvements thereupon), stem from my most basic attitude to make it better, faster, consistent and more efficient. I did not know all the bits and pieces going in, but I kept analyzing the control flow, kept learning around it, kept implementing stuff. Many times, it all broke down, cascaded. I would then pickup the traces and try better.
And quite frankly, stress tests helped a lot identifying the missed race conditions and straight faulty code which would break under dense usage. All credits to benchmarking in go.
I’ll keep working on this. I’ll keep making it better. Maybe, I would decide to revamp the core architecture, maybe keep polishing and generalising the existing setup, all depending on, again, what problem space takes priority. As getMe grows, I grow with it…


